Inspect model interactively
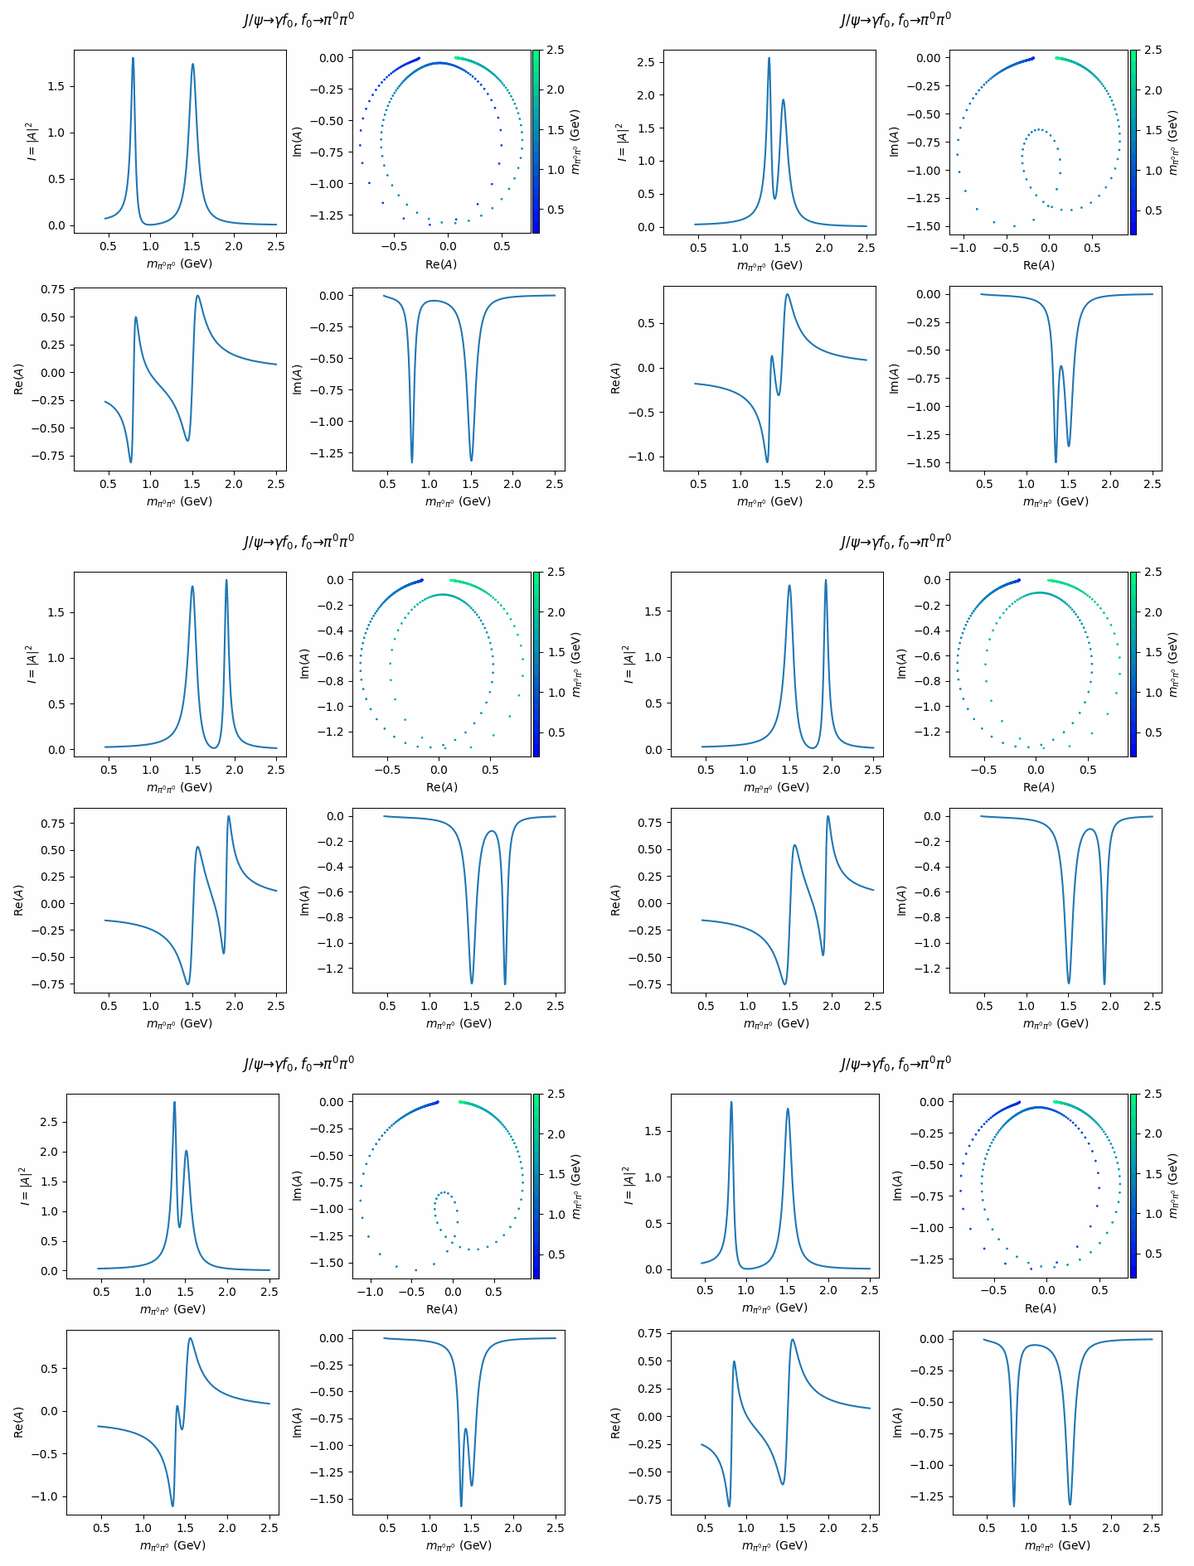
In this notebook, we illustrate how to interactively inspect the HelicityModel that was created in Formulate amplitude model. We do this with the excellent mpl-interactions package.
First, use pickle to load() the HelicityModel that we created in Formulate amplitude model:
import pickle

with open("helicity_model.pickle", "rb") as stream:
    model = pickle.load(stream)
In this case, as we saw, the overall model contains just one intensity term \(I = |\sum_i A_i|^2\), with \(\sum_i A_i\) some coherently sum of amplitudes. We can get the amplitude \(\sum_i A_i\) as follows:
import sympy as sp

amplitude = model.expression.args[0].args[0].args[0]
assert isinstance(amplitude, sp.Add)
Replace some of the boring parameters with the provided parameter_defaults:
amplitude = amplitude.doit().subs(
    {
        s: v
        for s, v in model.parameter_defaults.items()
        if not s.name.startswith("Gamma") and not s.name.startswith("m_f(0)")
    }
)
symbols = sorted(amplitude.free_symbols, key=lambda s: s.name)
symbols
[Gamma_f(0)(1500),
 Gamma_f(0)(980),
 m_1,
 m_12,
 m_2,
 m_f(0)(1500),
 m_f(0)(980),
 phi_1+2,
 theta_1+2]
Identify the symbols:
(
    gamma_f1500,
    gamma_f980,
    m_1,
    m,
    m_2,
    m_f1500,
    m_f980,
    phi,
    theta,
) = tuple(symbols)
…and use them to lambdify() the expression:
np_amplitude = sp.lambdify(
    (m, m_f980, m_f1500, gamma_f980, gamma_f1500, m_1, m_2, phi, theta),
    amplitude,
    "numpy",
)
Now we are ready to use mpl-interactions to investigate the behavior of the amplitude model. First, we define some functions that formulate what we want to plot:
import numpy as np


def intensity(
    m_values, m_f980, m_f1500, gamma_f980, gamma_f1500, m_pi, phi, theta
):
    values = np_amplitude(
        m_values,
        m_f980,
        m_f1500,
        gamma_f980,
        gamma_f1500,
        m_pi,
        m_pi,
        phi,
        theta,
    )
    return np.abs(values) ** 2


def argand(m_f980, m_f1500, gamma_f980, gamma_f1500, m_pi, phi, theta):
    values = np_amplitude(
        m_values,
        m_f980,
        m_f1500,
        gamma_f980,
        gamma_f1500,
        m_pi,
        m_pi,
        phi,
        theta,
    )
    argand = np.array([values.real, values.imag])
    return argand.T


def imag(m_values, m_f980, m_f1500, gamma_f980, gamma_f1500, m_pi, phi, theta):
    values = np_amplitude(
        m_values,
        m_f980,
        m_f1500,
        gamma_f980,
        gamma_f1500,
        m_pi,
        m_pi,
        phi,
        theta,
    )
    return values.imag


def real(m_values, m_f980, m_f1500, gamma_f980, gamma_f1500, m_pi, phi, theta):
    values = np_amplitude(
        m_values,
        m_f980,
        m_f1500,
        gamma_f980,
        gamma_f1500,
        m_pi,
        m_pi,
        phi,
        theta,
    )
    return values.real
Next, we need to define the domain over which to plot, as well as a range/domain for the sliders that are to represent the parameter values:
m_values = np.linspace(0.2, 2.5, num=400)
m_f980_values = np.linspace(0.8, 1.8, num=100)
m_f1500_values = np.linspace(0.8, 1.8, num=100)
gamma_f980_values = np.linspace(0.01, 1, num=100)
gamma_f1500_values = np.linspace(0.01, 1, num=100)
m_pi_values = np.linspace(0.01, 1, 10)
phi_values = np.arange(0, 2 * np.pi, step=np.pi / 40)
theta_values = np.arange(-np.pi, np.pi, step=np.pi / 40)
Finally, use mpl-interactions to plot the functions defined above with regard to the parameter values:
%matplotlib widget
import matplotlib.pyplot as plt
import mpl_interactions.ipyplot as iplt

fig, axes = plt.subplots(
    2, 2, figsize=0.9 * np.array((8, 7)), tight_layout=True
)
fig.suptitle(R"$J/\psi \to \gamma f_0, f_0 \to \pi^0\pi^0$")
((ax_intensity, ax_argand), (ax_real, ax_imag)) = axes
m_label = R"$m_{\pi^0\pi^0}$ (GeV)"
for ax in axes.flat:
    if ax is ax_argand:
        continue
    ax.set_xlabel(m_label)
ax_argand.set_xlabel("Re($A$)")
ax_argand.set_ylabel("Im($A$)")
ax_real.set_ylabel("Re($A$)")
ax_imag.set_ylabel("Im($A$)")
ax_intensity.set_ylabel("$I = |A|^2$")

controls = iplt.plot(
    m_values,
    intensity,
    m_f980=m_f980_values,
    m_f1500=m_f1500_values,
    gamma_f980=gamma_f980_values,
    gamma_f1500=gamma_f1500_values,
    phi=phi_values,
    theta=theta_values,
    m_pi=m_pi_values,
    ylim="auto",
    ax=ax_intensity,
    slider_formats={
        "m_f980": "{:.3f}",
        "m_f1500": "{:.3f}",
        "m_f1500": "{:.3f}",
        "gamma_f980": "{:.3f}",
        "gamma_f1500": "{:.3f}",
        "phi": "{:.3f}",
        "theta": "{:.3f}",
        "m_pi": "{:.3f}",
    },
)
iplt.scatter(
    argand,
    controls=controls,
    xlim="auto",
    ylim="auto",
    parametric=True,
    c=m_values,
    s=1,
    ax=ax_argand,
)
iplt.plot(m_values, real, controls=controls, ylim="auto", ax=ax_real)
iplt.plot(m_values, imag, controls=controls, ylim="auto", ax=ax_imag)

plt.colorbar(label=m_label, ax=ax_argand, aspect=30, pad=0.01)
plt.winter()
